Friday, 19 June 2026

Is all pollution bad?


Dear Simon,


One of the great conceits of the Victorian civil engineer Joseph Bazalgette was that he gave the nation a sewage system of which we could be proud; the truth is more nuanced. What he really did was create a grand network that gathered human and industrial waste, put it in large pipes which in turn dumped the output in the nearest river or sea. Since then, at least until very recently, out of sight, out of mind has been the prevailing ethos of sewage management.


To a certain extent, when the waste was largely organic and the population considerably smaller, Mother Nature was able to absorb whatever we chose to engulf her with but how times change. Waste has become more chemical and toxic; the residues will hang around for not just years or decades but centuries. This damaging habit, embedded into the system by Bazalgette, is what the industry calls combined sewer overflows when rainwater and wastewater are carried through the same pipes. During heavy rainfall, these systems can exceed capacity, releasing untreated or partially treated sewage into rivers and coastal waters. For many years the assumption has been that however bad this was, it was not as bad as the overflows from the wastewater treatment works themselves. However, new research from Imperial Collage London challenges this cosy assumption.

Is the Lake Windermere project, pictured in full algal bloom, where the smart money is going?

Without going too much into the considerable data of the Imperial research, they come to two different conclusions. Firstly, the pollution caused by the combined sewer overflows is of similar volume to that of wastewater treatment works and sometimes greatly more damaging due to the nature of the effluents. Secondly, not all combined sewer overflows are equal with a small proportion responsible for a disproportionately large share of total pollution. So what, you might think, is not all pollution bad?


On that I think we would all agree, but with money in short supply, we need to take whatever infrastructure cash is around to improve the 45% of wastewater systems in England that Imperial have designated as falling into high or very high environmental risk categories. The simple fact is that there is never, ever going to be enough money in the short to medium term to address every bit of our ageing infrastructure.


We need to be smart about using whatever cash there is and focus on where it can most improve the health of England’s rivers. Now that is never going to be easy; some rivers will win whilst others lose. It may even mean taking money from one part of the country and giving it to another. Imagine the furore if say part of your water bill as a Yorkshire Water customer is rerouted to Thames Water. But that is the sort of hard decision politicians, not regulators, have to make if we want clean rivers. As George Orwell might have said, all pollution is equal, but some pollution is more equal than others.


You may read the Imperial report here .....

Things that go unseen

It is strange how you can live somewhere for nearly three decades without noticing something you have passed by thousands of times but without registering or noticing its existence. This benchmark, carved into the brickwork by my front door to The Mill is precisely that.


As you know I was hosting events here last week to celebrate the launch of Tales from The Mill and it was only when preparing for that, walking the walk, that I spied the carving. I knew instantly that it was a benchmark, and maybe long ago I know of their purpose, but it was only when I asked one of the groups if they knew of that purpose some knowledgeable members of the party supplied the answer: an Ordnance Survey benchmark to map the height above sea level.

Benchmark bottom righthnand corner of brickwork

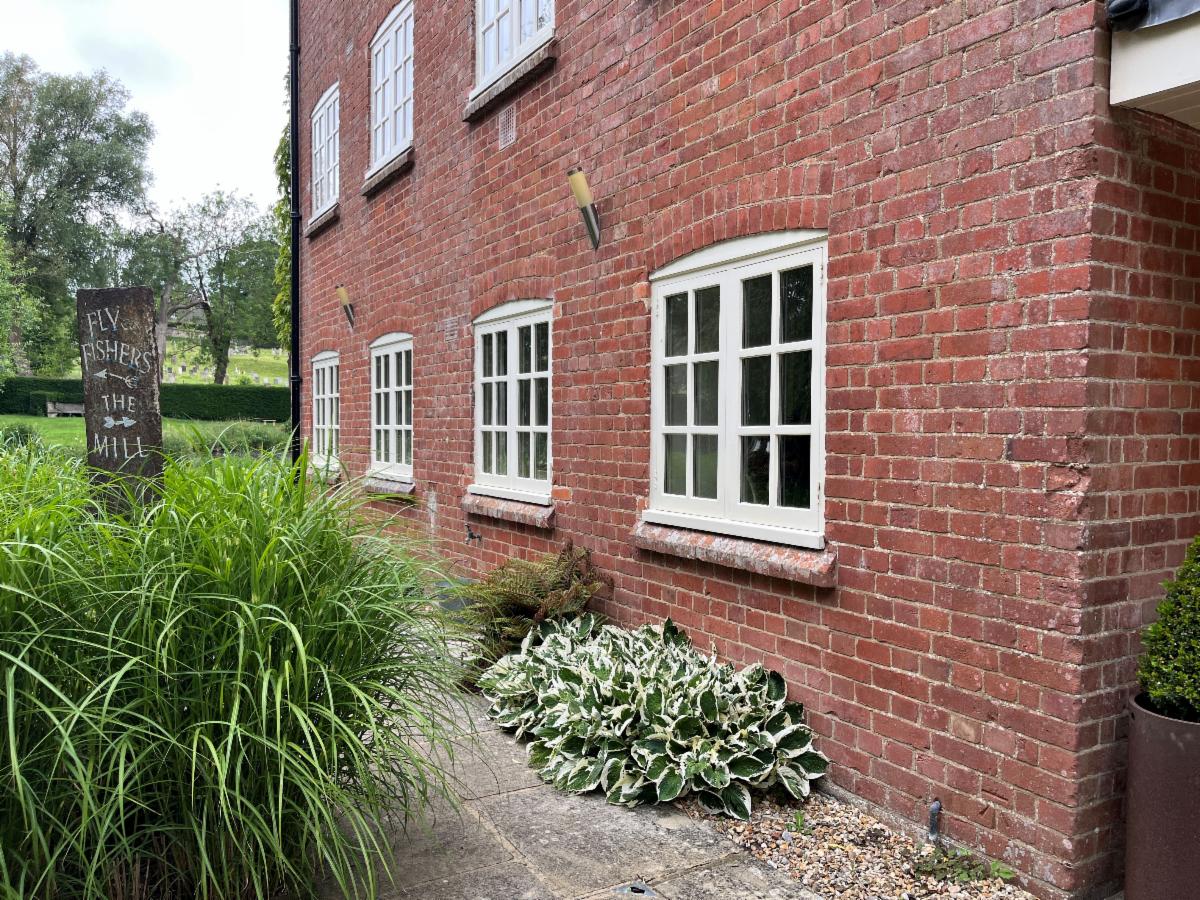
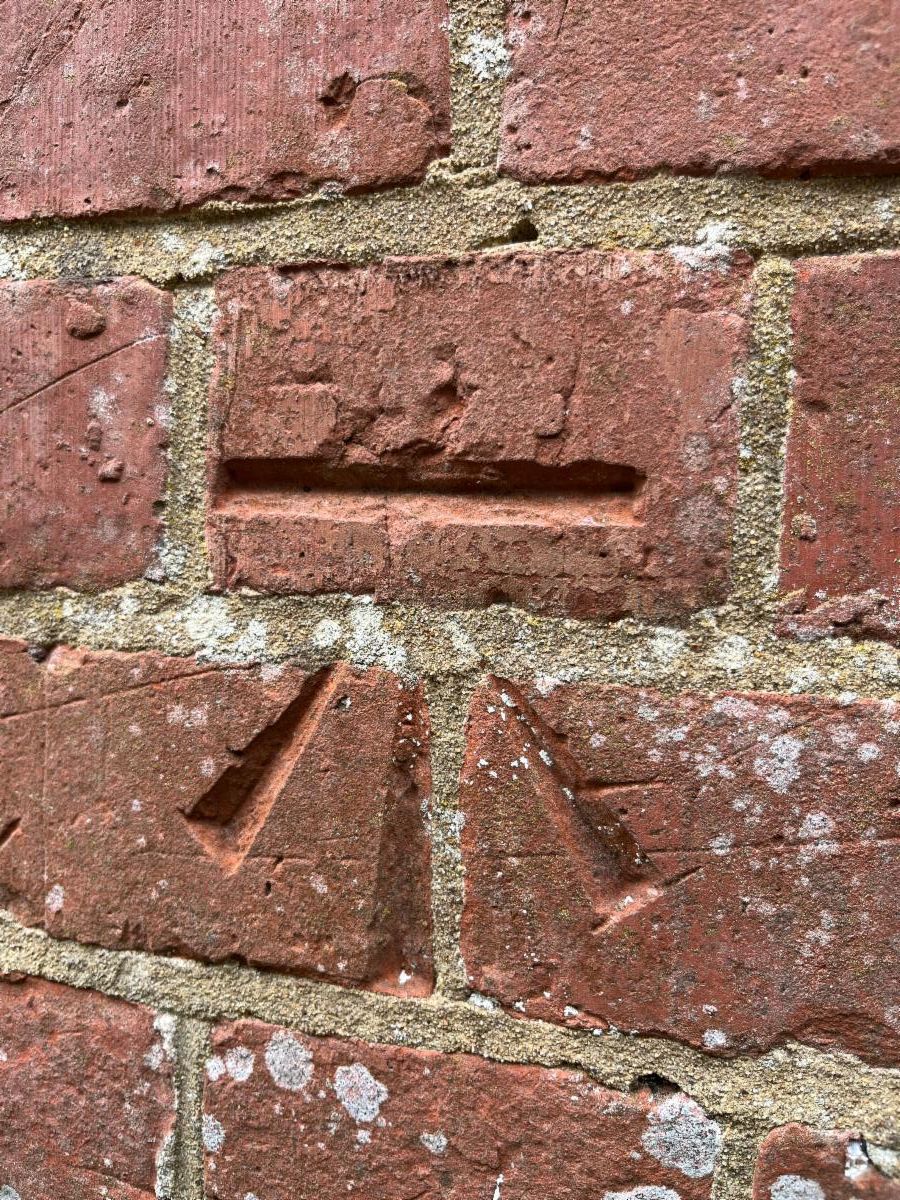
There is, apparently, a mammoth network of benchmarks or ‘broad arrows’ which have been ‘chiselled’ into buildings by the Ordnance Survey mapping company since 1840 to help surveyors measure altitude relative to mean sea level. In total some half a million marks have been made since then in three distinct Geodetic Levelling phases of 1840–1860, 1912–1921 and 1951–1956. However, many of the buildings along with the marks, have long disappeared.


I must admit I have never really thought about the concept of sea level; it seems to me to be one of those universal constants like gravity but I guess, when you think about it, is sea level measured at high tide, low tide or somewhere in between? And does the level vary according to coastal or country location? Well, as it turns out there is a thing called Ordnance Datum Newlyn which is the official vertical reference framework for mainland Great Britain.


Established using tide gauge measurements taken in Cornwall between 1915 and 1921, it defines 'height zero' which dictates the elevation of all hills, buildings, and maps across the country. Of course, that all does rather beg the question how do you measure your benchmark against height zero which is certainly not visible and maybe hundreds of miles distant? The trick was that surveyors used a specialised spirit level to perform geodetic levelling with which, starting from Newlyn, they measured the height difference between one fixed point and the next which in my case, thanks to the comprehensive record keeping of Ordnance Survey, we know took place in 1958.


Anyway, at 166 feet (or 50.56m) above sea level it is good to know that it is one form of flooding I do not need to worry about.

The Natural History GCSE is a natural


Once a year I give a talk about chalkstreams to 13-15 year olds at The Wellington Academy. Located, as it is on the edge of Salisbury Plain and close to the Army town of Tidworth, this secondary school has an eclectic mix of pupils most of whom you might think have little interest in nature, let alone chalkstreams. But once they twig that the River Bourne that flows through their town is a stream in which they have all swum, paddled or played their ears prick up and become incredibly engaged.


I go away heartened that a generation, often badged as screen obsessed, can have a hinterland to their lives if only shown the way to that land. That in turn gives me hope that the newly announced GCSE in Natural History will be a great success engaging a whole new generation to the countryside because I absolutely know the interest is there. Whenever we run our kids camps here at The Mill the two most popular moments are a) the kick sampling and bug identification and b) the fish gutting which, aside from the attraction of the gore, becomes an interactive biology lesson.

A few places left on the Summer Kids Camps for 8-11 years and 12-15 years.

Click here for details ....

My one concern is that the course does not become obsessed with climate change. I am no denier or sceptic but as I always reply to the earnest pupil who asks about the impact of climate change, the truth is that we are already making a fine job of poisoning our rivers and countryside so, unless we do something about that sharpish, both will become toxic sinks long before climate change gets us.

Photo of the Week


Here is how you cast the full length of a fly line, all 90 feet of it! Photo by Ed Sozinho from Hatch Magazine.

Quiz


A short selection of questions based on the topics in this newsletter, the date today or something topical.


1)     Which cartoon cat debuted on this day is 1978, though has become rather foul mouthed with age?


2)     In what year did pupils sit the first GCSE’s? A) 1978 B) 1988 C)1998


3)     What do you call a person who draws or produces maps?


It is just for fun and the answers are below.


Have a good weekend. Go Scotland!


Best wishes,

Simon Signature

Simon Cooper simon@fishingbreaks.co.uk

Founder & Managing Directorwww.fishingbreaks.co.uk

Quiz answers:


1)     Garfield, created by Jim Davis, first appears as a comic strip

2)     1988

3)     A cartographer

No comments:

Post a Comment